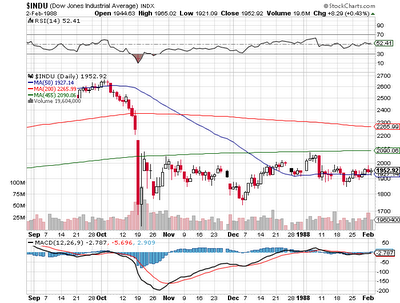
In looking at the 1987 crash, I noticed some similarities to our present situation in the stock market. When we look closely at the 1987 data, we notice that the RSI was over 50% just before the crash, but the 12 day MACD has just crossed the 26 day MACD.
If we look back at the flash crash of May 2010 we see a similar pattern emerge:
Note how the 12 day MACD crosses the 26 day about 10 to 14 days before the crash, and that RSI is again just above the 50% level.
If this pattern is correct we should consider the mathematical application of fractals such as the Elliot Wave principle. The Elliot Wave principle is just one type of technical analysis that uses the application of fractals.
From Wikipedia:
Benoit Mandelbrot is the mentor of Nassim Taleb of Black Swan fame.
An article from Bloomberg:
Analysts in Math Denial
A few excerpts:
My conclusion in viewing these patterns, is that we may indeed be looking at a sudden move downward in the stock market within two weeks.
Unless, I am finding patterns that are not there?
Hopefully I am wrong.
Sept 2 updated chart:
If we look back at the flash crash of May 2010 we see a similar pattern emerge:
Note how the 12 day MACD crosses the 26 day about 10 to 14 days before the crash, and that RSI is again just above the 50% level.
If this pattern is correct we should consider the mathematical application of fractals such as the Elliot Wave principle. The Elliot Wave principle is just one type of technical analysis that uses the application of fractals.
From Wikipedia:
A fractal is "a rough or fragmented geometric shape that can be split into parts, each of which is (at least approximately) a reduced-size copy of the whole,"[1] a property called self-similarity. Roots of mathematically rigorous treatment of fractals can be traced back to functions studied by Karl Weierstrass, Georg Cantor and Felix Hausdorff in studying functions that were continuous but not differentiable; however, the term fractal was coined by Benoît Mandelbrot in 1975 and was derived from the Latin fractus meaning "broken" or "fractured." A mathematical fractal is based on an equation that undergoes iteration, a form of feedback based on recursion.[2]
- ^ Mandelbrot, B.B. (1982). The Fractal Geometry of Nature. W.H. Freeman and Company.. ISBN 0-7167-1186-9.
- ^ Briggs, John (1992). Fractals:The Patterns of Chaos. London : Thames and Hudson, 1992.. pp. 148. ISBN 0500276935, 0500276935.
Benoit Mandelbrot is the mentor of Nassim Taleb of Black Swan fame.
An article from Bloomberg:
Analysts in Math Denial
A few excerpts:
Meyer Shields says earnings at Warren Buffett’s Berkshire Hathaway Inc. will increase the most since 2006 this year. He’s also telling investors to sell the shares because the economic recovery is weakening.
The Stifel Nicolaus & Co. analyst has plenty of company. For the first time since at least 1997, fewer than 29 percent of ratings for stocks covered by brokerages worldwide are “buys,” according to 159,919 recommendations compiled by Bloomberg.
“It’s negativity on the economy and therefore the ‘sell’ rating on Berkshire,” Shields said in an interview from Baltimore. “Employment is much worse than what people have anticipated.
“I’m no macroeconomist, but you’re certainly seeing data that suggests that things are slowing down,” Schafer said in an interview Aug. 26, the day before Intel lowered its sales forecast. “We’re underweight semis as a sector. We have seen peak earnings and most likely peak gross margins for this particular cycle.”
The correlation between the U.S. equity benchmark and its individual members was 0.81 in the 50 trading days through July 7 and has since remained close to that level, Birinyi data show. That’s almost twice the historical average of 0.45 from the past 30 years. A higher number means moves in individual stocks are increasingly related to the direction of the index as a whole and not on their own earnings prospects or valuation, the Westport, Connecticut-based research firm said.The final part of the Bloomberg article is the key to understanding the risk and uncertainty in the market currently. If individual stocks are moving in lockstep with the S&P 500 index, the amount of risk has escalated tremendously and is reflecting fractal behavior. While it is difficult to say with certainty that a correction is pending, the environment for one seems ripe.
My conclusion in viewing these patterns, is that we may indeed be looking at a sudden move downward in the stock market within two weeks.
Unless, I am finding patterns that are not there?
Hopefully I am wrong.
Sept 2 updated chart:


Nice blog and very interesting articles. I added your site to my list of blogs I am reading so I am redirecting some of my readers to your blog.
ReplyDeleteIn terms of trading stocks I am trying not to worry too much about the long term but I also don't want to get burned by trading on very short time frames so I chose the middle ground, the intermediate time frame, that gives me the possibility to take advantage of any mini-rally or any mini-plunge.
Anybody interested in my timing indicators can find me at:
http://babaro22.blogspot.com/
All the best and happy trading!
Do you have a current chart handy?
ReplyDeleteAnonymous at 10:47pm, an updated chart has now been included at the bottom of this post.
ReplyDelete